Performance Tuning
Task Manager
Performance
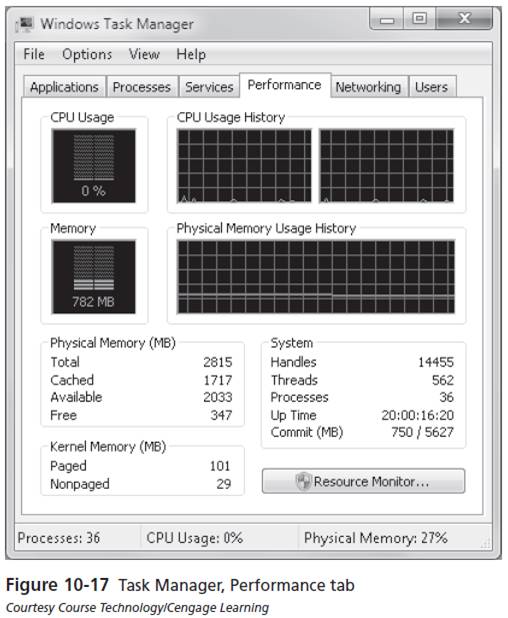
The Performance tab of the Task Manager indicates important conditions of your OS. It shows a dynamic overview of your computer's performance, including CPU usage, memory usage, and totals of handles, threads, and processes.
- CPU History : It is used to show different graphs for each CPU (only useful on multiple-CPU systems)./li>
- Show Kernel Times: It sets the display to show kernel activity in red and user activity in green on the CPU and memory usage. If your system has two or more CPUs or a dual- or quad-core CPU, you will see a separate CPU gauge for each physical CPU or CPU core.
You can easily check in the Physical Memory area to see how much memory is installed in your system, how much is available for use by applications before disk caching begins, and how much the system is using for caching.
The Kernel Memory area reports the memory in use strictly by the OS for running the OS internals. Nonpaged kernel memory is available only to the OS. This memory is in physical RAM and can't be paged out to the hard disk because the OS always needs fast access to it, and it needs to be highly protected. Paged memory can be used by other programs when necessary.
In the System section, you can see the number of handles, threads, and processes.
- Handles are tokens or pointers that let the OS uniquely identify a resource, such as a file or Registry key, so that a program can access it.
- A thread represents a single subprocess. An increasing number of programs are multithreaded, running multiple subprocesses at the same time. Multithreading applications are designed to run better on multiprocessor or multicore processors such as the AMD Phenom and Athlon 64 X2, Intel Core 2 Duo and Core 2 Quad, and others.