Performance Tuning
Performance Monitor
Performance Monitor
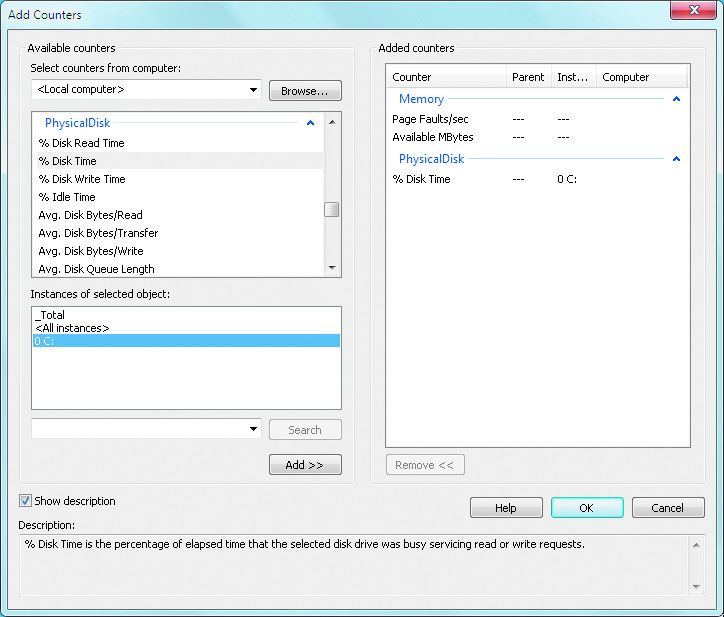
- Performance Monitor is a tool within Reliability and Performance Monitor that allows you to visually display the data generated by counters. For each counter, you can view the last, average, minimum, and maximum values. Performance Monitor can also be used to view logged data.
- Performance Monitor allows you to select the counters you wish to view.
- The counter categories supported by Performance Monitor include:
- Cache: Counters that monitor the file system cache in memory.
- IPv4: Counters that monitor IPv4 data transfer rates and errors.
- LogicalDisk: Counters that monitor individual partitions and logical drives on a disk.
- Memory: Counters that monitor virtual and physical memory use.
- Network Interface: Counters that monitor network card performance.
- PhysicalDisk: Counters that moonitor the performance of each physical disk, regardless of the partitions and logical drives that are on it.
- Processor: Counters that monitor processor activity.
- System: Counters that monitor general system statistics that may combine elements from other categories.
- The chart types offered by Performance Monitor include:
- Line View: The line view is the Performance Monitor default view. It's useful for viewing a small number of counters in a graphical format. The main advantage of line view is that you can see how the data has been tracked during the defined time period.
- Histogram View: The histogram view shows the Performance Monitor data in a bar graph. This view is useful for examining large amounts of data. However, it shows performance only for the current period. You do not see a record of performance over time, as you do with the line view.
- Report View: The report view offers a logical text-based report of all the counters that are being tracked through Performance Monitor. Only the current session's data is displayed. The advantage of report view is that it allows you to easily track large numbers of counters in real time. It is important to note that when you view data in real-time format, the data can appear skewed as applications and processes are started. It is typically more useful to view data as an average over a specified interval.
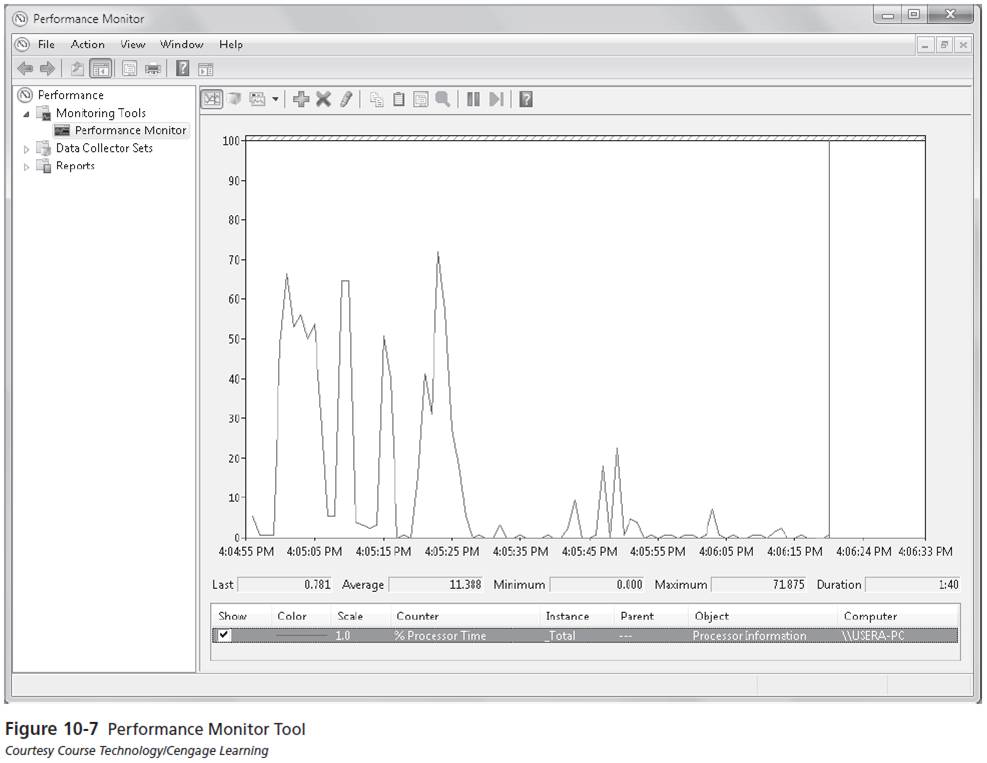
Customizable counters are listed at the bottom of the Performance Monitor window. By default, only the % Processor Time counter is tracked for the local computer. The fields just above the counter list will contain data based on the counter that is highlighted in the list.
| Data Field | Description |
|---|---|
| Last | Displays the most current data |
| Average | Shows the average of the counter |
| Minimum | Shows the lowest value that has been recorded for the counter |
| Maximum | Shows the highest value that has been recorded for the counter |
| Duration | Shows how long the counter has been tracking data |