Performance Tuning
Performance Monitor
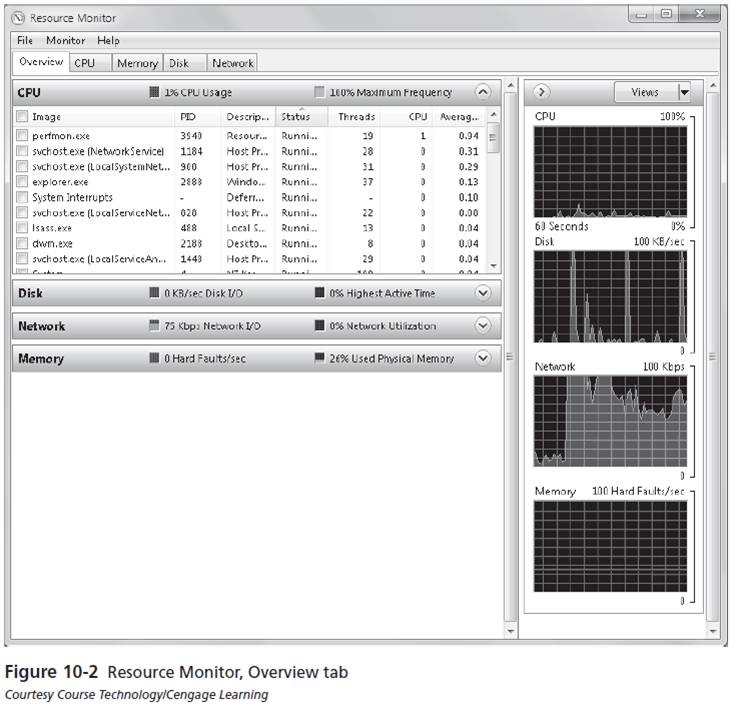
Resource Monitor
Resource Monitor provides real-time monitoring of the most common system performance indicators. It monitors for the following areas:
- Overview: The Overview tab of the Resource Monitor dialog box opens by default and gives you a fair amount of detail. The main window provides an overview of the four major subsystems monitored by default (CPU, Disk, Network, and Memory).
- CPU: The CPU tab displays the individual processes currently running on the machine, the process IDs (PIDs), a brief description, the running status of the process, how many threads the process is running, current CPU utilization, and average CPU utilization.
- Disk: The Disk tab of Resource Monitor is used to display the disk activity of your machine. The items available to view are Processes With Disk Activity, Disk Activity, and Storage. The Disk tab includes a real-time graphical representation of disk transfer in KB/sec and disk queue length (the amount of transfer currently waiting for transfer to RAM for processing).
- Network: The Network tab of Resource Monitor shows network utilization as well as network protocol information. The items available for detailed information include Processes With Network Activity, Network Activity, TCP Connections, and Listening Ports. The Network tab offers a huge amount of useful network information (we have opened the Listening Ports item in the figure) as well as the real-time graphical information for network data transfer, open TCP connections, and local area connection usage as a percentage. You can view any of these counters in Resource Monitor as well as Performance Monitor.
- Memory: The Memory tab of Resource Monitor shows the process information as displayed on the CPU tab with an overview of memory allocation in the form of a graphical representation. The right side of the display also shows you real-time information of the physical memory and the currently allocated memory, called the Committed Charge and Hard Faults/Sec (the number of memory accesses that are not actually in RAM, but in a page file waiting to be used).